01
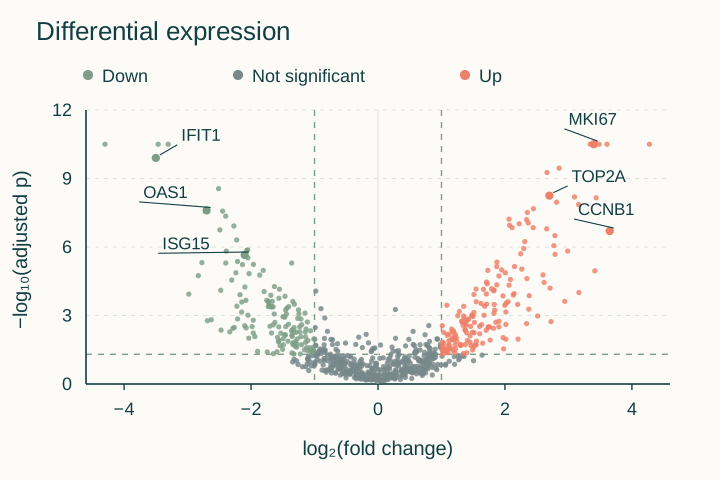
Volcano
Explore differential-expression results with explicit effect and significance thresholds.
Five plot types. One workspace.
Explore expression results, sample relationships, distributions and fermentation time courses. Choose a plot, adjust the details and export for your paper.
Currently free to use.
Research data and plotting calculations stay in your local browser.
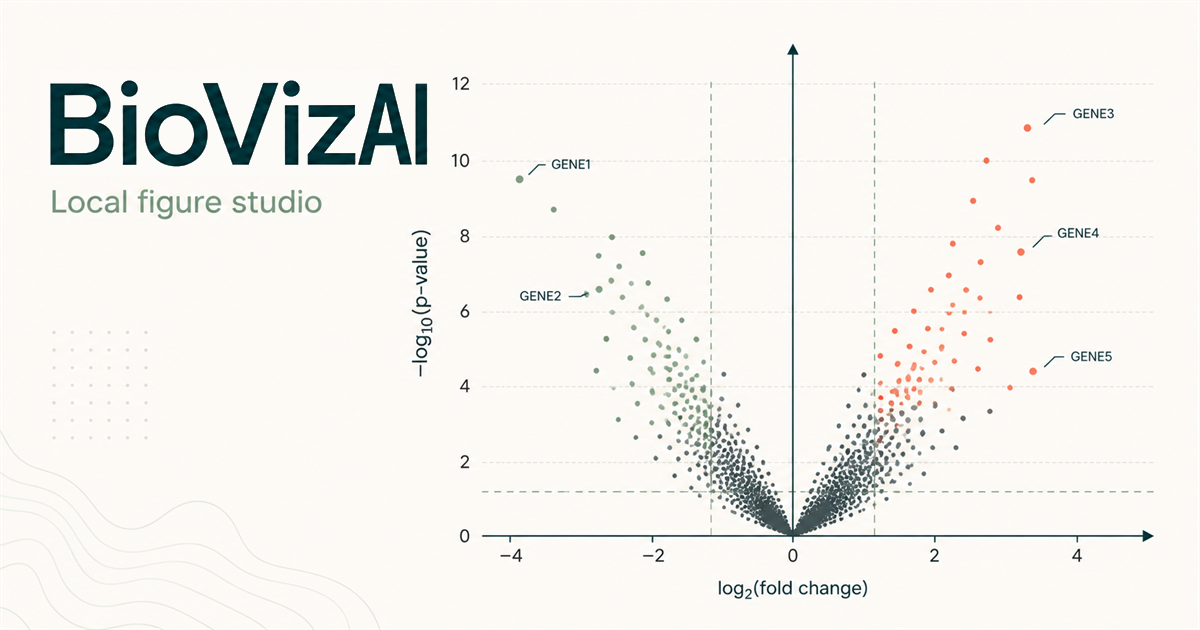
Find your plot
From a differential-expression table to a growth curve, start with the question you want your figure to answer.
01
Explore differential-expression results with explicit effect and significance thresholds.
02
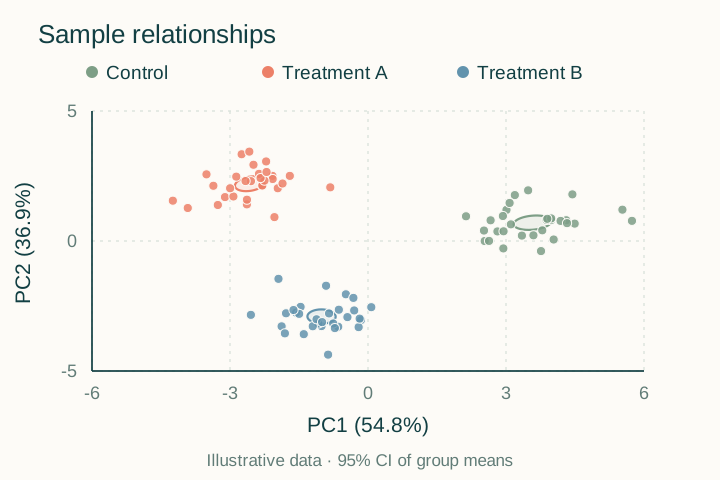
Use coordinates directly or calculate PCA from a feature-by-sample expression matrix.
03
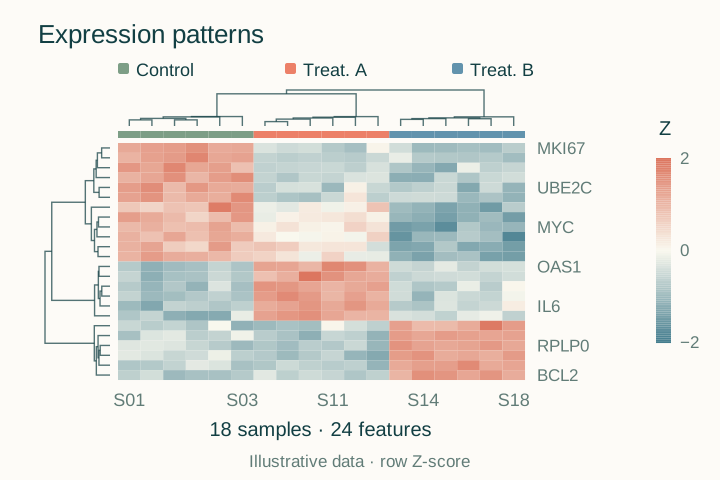
Cluster features and samples with explicit distance and linkage settings.
04
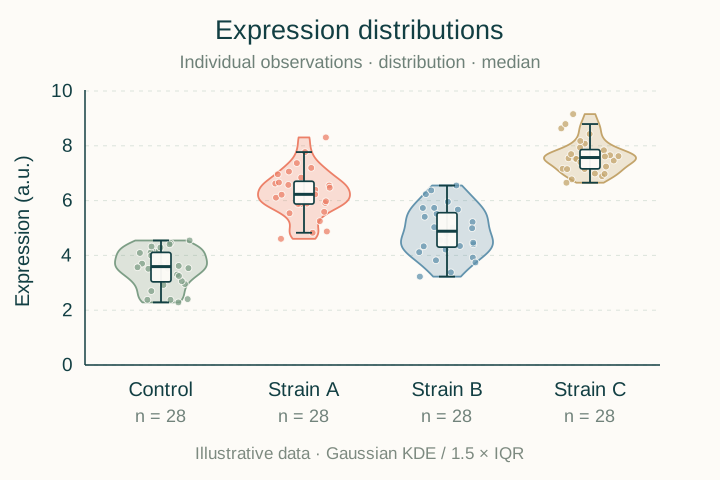
Compare distributions from long- or wide-format observations with user-selected tests.
05
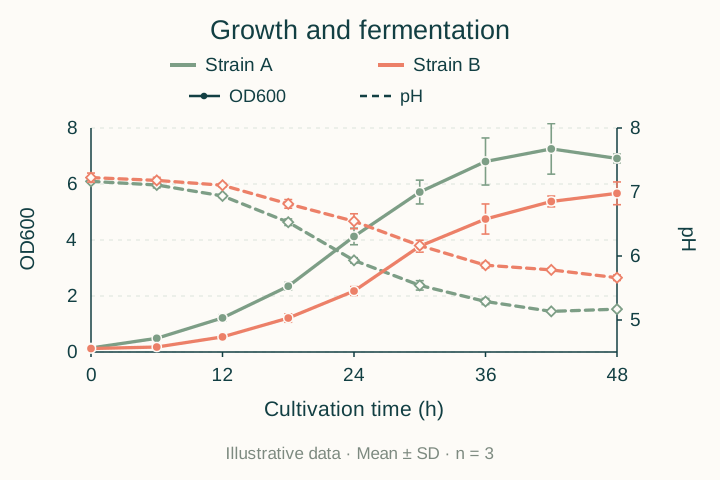
Compare strains and batches over time, with biological-replicate SD/SEM and dual Y axes. CSV input.
Illustrative figures made with example data.
A simple workflow
Choose a plot for your data, confirm the fields and prepare your figure for a paper or presentation.
Choose a table format supported by your plot: XLSX, CSV, TSV or TXT where available; CSV for fermentation.
Review the fields, axes, labels and colors. For fermentation, confirm biological replicates and choose SD or SEM.
Download editable SVG, vector PDF or 300 dpi PNG for your paper, presentation or further editing.